

A new bull market is born
A new bull market is born
Market Recap, Week 2-6 October 2023 [ENG]

Have a great Sunday, surfer!
Due to a lack of connection (I am and will be in Qatar for the next two weeks) the weekend market report usually published on Sunday is published now. Charts do not take into account the day of Monday, October 9 Will follow an update tomorrow Tuesday, October 10.
In this appointment, we talked about:
Where has the capital gone in the last two months?
How to interpret this rotation toward growth stocks?
Let us look at the RRG graph
Correction over? Here's what the VIX tells us.
Market breadth for discovering reversals
Where has the capital gone in the last two months?
One of the bulls' points in last week's summary (Breakdown: truth or lies?) was this:
I don't see a big capital outflow from RISK ON areas.
But what does it mean?
I want to share with you a very interesting chart on growth vs. value (or aggressive vs. defensive) stocks.

Taking the highs of August 2023 as a reference, each of the ratios illustrated did not experience any relative declines, in fact, all of them were sideways bullish.
That's why I said I don't see a big capital outflow from RISK ON areas. I mean, it was pretty obvious.
As you know, the study of capital flows is one of the elements I consider in the analyses you have seen on these screens for quite some time.
However, we know that prices are always in charge, and if they go down as they have been for the past 2 months, we do not have much leeway for trades on the long side.
Studying the flow of capital makes us “only” understand what the big picture of the market is and know that someday the time will come to top up the portfolio (note, the “only” is intentionally provocative).
Throughout August and September, we made few trades on the long side, simply because we respected the descent of prices, even though these ratios were showing no signs of subsiding.
In other words, falling prices and the rising trend of RISK ON ratios should cause us to wait for the right time to strike at the right time.
Although Friday's day was a success and the situation from capital flow is extremely encouraging, there is still not the fundamental technical element for the long-awaited bankruptcy breakdown that will only be triggered when we decisively break the 4350 area.
How to interpret this rotation toward growth stocks?
I will add another observation using the previous chart, where I highlighted the date of the FED meeting with the dashed vertical line.
In general, higher interest rates should mean lower future valuations for growth stocks and thus lower prices.
Here is a chart of rates on the U.S. 10-year, TNX, showing a tirelessly rising trend.

After the Fed meeting two weeks ago, the market reacted in a diametrically opposite way, with a surge in reports favoring growth areas over value areas.
So, we have the stock market and the bond market with abnormal behaviors if we consider the Intermarket analysis, and one of them is lying.
Considering all the context and the analysis done, what I think is that the stock market's reversal is over, or at any rate, it is not likely to last much longer.
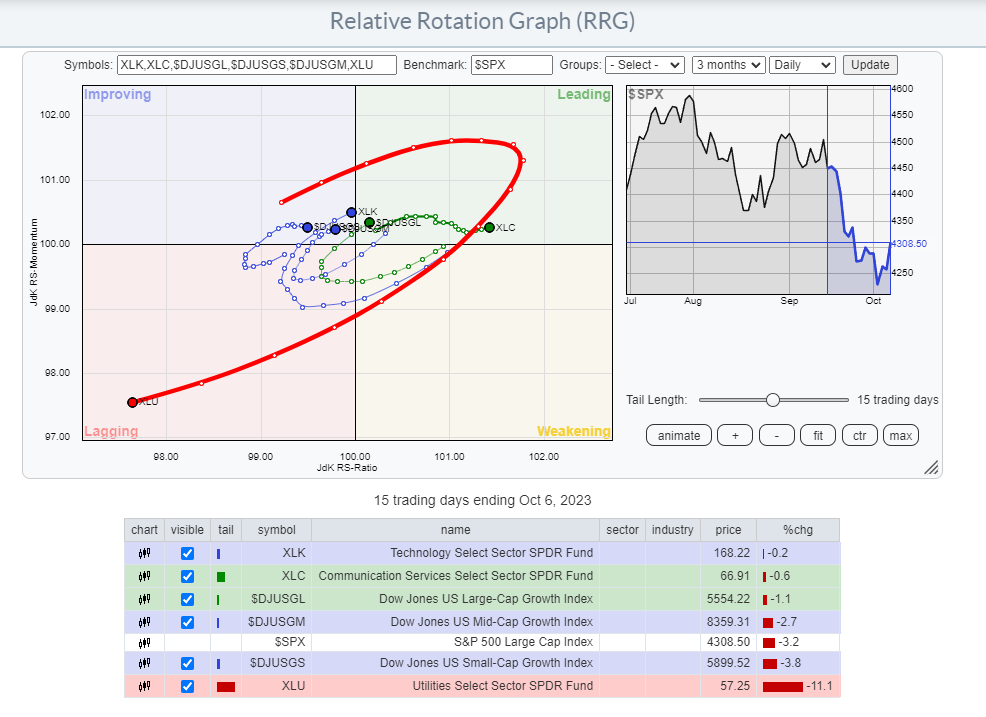
Let us look at the RRG graph
All this talk has been made so far is even more evident when using the RRG graph.
RRG stands for Relative Rotation Graph and is nothing but a different way of analyzing capital flow.
We see how all the areas analyzed have had a constructive rotation from the lagging quadrant toward the improving quadrant and are now facing the leading quadrant, that is, outperforming the benchmark S&P 500, all while the S&P 500 has fallen from 4450 to 4250 points

Look at what happens if we add utilities to the RRG chart, using the XLU ETF.
It can be seen that utilities are not a good sector in which to park capital, as it continues to heavily underperform the benchmark.
Defense sector underperforms= bullish backdrop for stocks
Keep in mind that there are no certainties when it comes to predicting the direction of the market, as it is an inherently unpredictable realm.
I have made wrong predictions in the past and will no doubt make more in the future. My goal is not to get a record of analysis correct, but rather to mitigate risk correctly.
And now the “risk” is that the downward trend is over and a new bullish accumulation phase is underway, so equip yourself accordingly by managing the risk.
Correction over? Here's what the VIX tells us
Sentiment has been in extremely dangerous territory for two to three weeks.
I have told you several times about the put-call ratio (CPCE), which has remained stationary at very high levels comparable to a market bottom.
Now let's do an update on the VIX.

From this graph, we observe two things:
Level 20 is the first hurdle of market lows
Level 30 for the deepest corrections
We see how there has been a decorrelation between VIX and S&P 500 in the last two months, where VIX has never managed to rise above 20 despite falling prices for two consecutive months.
And right in the middle of the week just ended, the VIX failed to break out the 20 areas, a level that on the last occasion coincided with an upward trend.
Market breadth for discovering reversals
Spotting market reversals can be a considerable challenge, and during bearish phases, it is prudent to be patient and adopt a cautious attitude.
Numerous tools are available to assess whether the stock market has hit its low point from the world of breadth analysis over different time horizons.
A particularly effective tool for the short to medium term is the Bullish Percent Index (BPI) which we have seen several times in the past.
Taking a quick look at the chart, we see that the BPI of the S&P 500 is below the threshold of 30, typically indicative of a situation with an upward countertrend movement.

In the past year, there have been two cases where this indicator has fallen below 30
October 2022 (all to the left of the graph)
March 2023.
On both occasions, the S&P 500 had declined substantially, but even more important was the subsequent reversal.
Analyzing the graphs, it is clear that the technology and communication services sectors stand out as strong.
Consequently, barring significant changes in the market landscape, these segments are likely to lead the next rally.
Happy trading!