

Daily Report, September 13th 2022 [ENG]
Daily Report, September 13th 2022 [ENG]

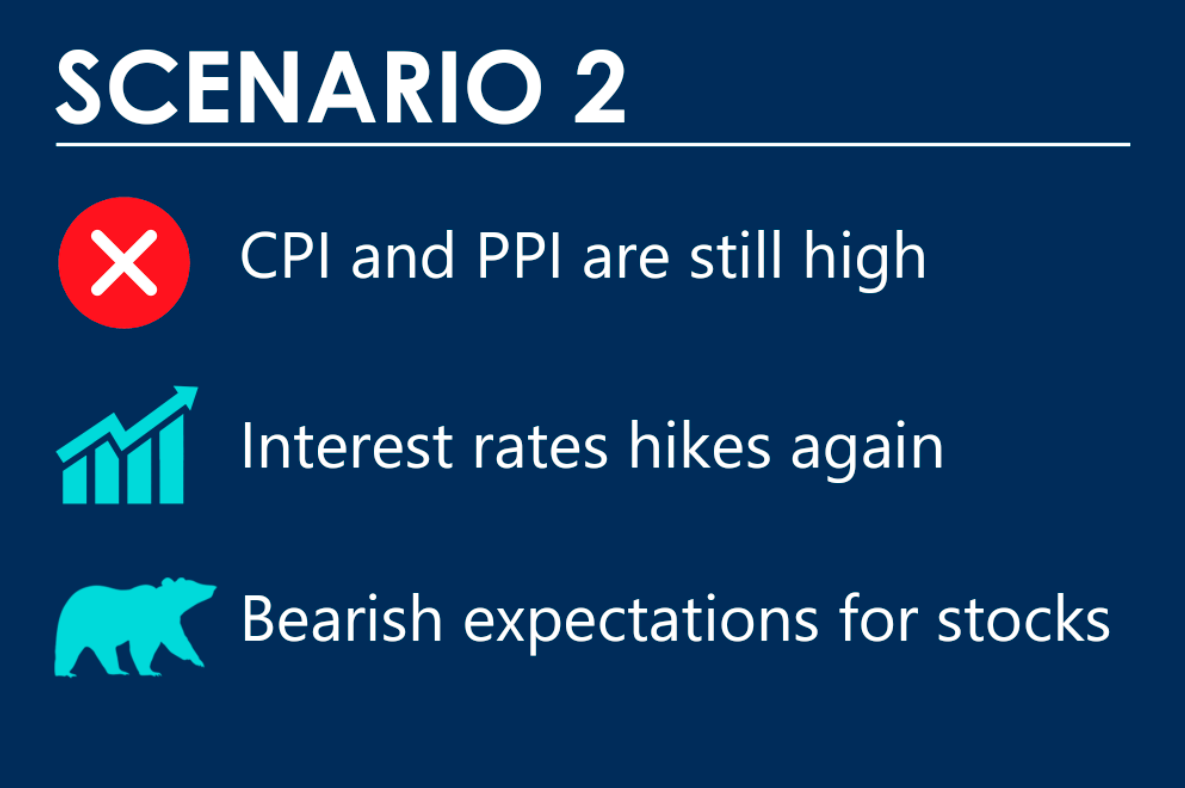
As you have seen in the Market Recap, Week 5 Sept-9 Sept 2022, we presented in advance two scenarios according to the publication of the macro data of these days.
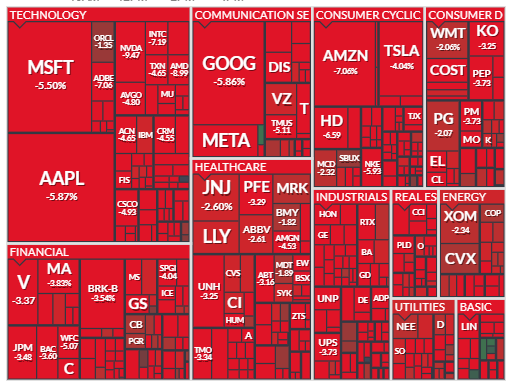
Wall Street's reaction was not long in coming; there was no mercy for buyers who saw a drop of nearly 225 points in today's session of the SP500 index, the worst day of all 2022.
We do not like to explain the movements retrospectively, but for educational purposes, we want to invest in writing because the market has risen in the past days and then fell ruinously today:
The market anticipated a lower-than-expected CPI, and when it was released, the markets priced in an interest rate hike from the Fed: a 20% chance of a 100bp hike and an 80% chance of an increase of 75 basis points.
Technical resistances
A better than expected CPI would have triggered a probable short squeeze and today we would have told a different story
We believe that consumer price inflation, the CPI figure released today, is more critical than the inflation on production PPI which will be published tomorrow before the markets open.
The big difference, of course, we should face it after a -4.3% of SP500 and -5.5% of Nasdaq 100.
Like the CPI measures inflation for end consumers, the PPI measures price pressures on producers and companies, etc.
In order not to miss anything, we remind you that Friday 16th we have BIG and heavy technical deadlines that will bring further volatility.
Possible macro scenario 2023
Market attention will soon shift from the monthly CPI to the FED's failing policy results.
The Fed printed a lot of money last year by miscalculating that it could control inflation.
At some point the Fed will be crushed by political pressure, as the US system cannot manage 4% or more interest rates for an extended period and there is a real risk that it will collapse under the weight of the debt.

Therefore, in our opinion, it will not matter what the CPI data is; if rates remain high, the outcome on the markets remains unknown, but it will certainly not be idyllic
We do not want to generate any panic, but it is a possible scenario to be taken into account if things do not change in the coming months. In any case, we would still have unequivocal signals from the graphs which, as always, will anticipate the macroeconomic scenario.
US ten-year yields, TNX
No more chatter and let's move on to the technical side
Bond traders sold heavily, as we assumed in scenario 2.
Eyes on the key resistance at 3.5%, the highest level since 2011 reached in June 2022.
This year, the S&P 500 went up and down with a big influence on treasury yields
Beware that this is not always the case, we do not dwell too much on the reasons in this article, just look at the movement of SP500 from 2016 to 2018 in a context of rising rates
Today, the TNX has risen to touch this area and by a whisker, it has not moved above the key area
Here is a very long-term graph to illustrate the meaning:

Rates are still at historically low levels, so we believe the stock market can weather the short-term storm and eventually return to all-time highs by the end of the year, or more likely, during the first quarter of 2023 (Fed permitting).
This situation of uncertainty in the markets could continue until the end of September, so we must respect it and remain cautious with the technical levels discussed in past columns.
Breadth Analysis Update
We introduced this breadth measurement in the Market Recap, Week 5 Sept-9 Sept 2022

We observe how the green histogram in the past days was around 80% while today the red histogram is higher than 90%
We don't want to talk too soon, but historically violent movements in both directions (as happened these days), typically occur during a process of bottomining which does not mean that it will happen tomorrow, let's be clear, let's talk about a process and how such needs time and patience
We had a similar but less marked situation on June 14: a few days later the SP500 reached its low
Some intraday levels for SP500
The key area will be 3970/3980 for SP500.
Bearish attitude under the key area with targets in the 3880-3890 area.
Openings or trades above 3980 (with the help of stocks such as APPL and TSLA) can push us up to 4010 and beyond.
On this second point, spend a few words on APPLE
APPLE
Apple is the largest company in both the S&P 500 and especially the NASDAQ 100.
To say it was a bad day would be an understatement.
After seeing an increase in volumes on Monday that accompanied a key breakout above 160 $ and above the moving averages, AAPL made a nuclear reversal.
It remained below both moving averages, and sales only increased throughout the day.
The PPO's behavior is rather bearish, suggesting that this move is probably not over; but anything could happen considering the high volatility of this week.
This movement is extremely unusual for a company with a market capitalization of 2.5 trillion and overall we see it as anxiety and concern in the market.

One magnetic level is the 61.8% Fibonacci retracement level, which is currently in the 147.5 $ area
Based on today's CPI report, 10-year Treasury yield, and Wall Street reaction (RISK ON growth sectors such as Technology and Discretionary are being hammered like there's no tomorrow), we see further warning signs in the near term. that we must respect.
How did our portfolio
Despite the exposure of almost 80%, today our portfolio has lost “only” 2.5% in spite of the performance of the stock market which risked the suspension of trading due to excess downside (which jumped to -7%).