

[ENG] Smash the Cubes

We promised you a surprise that we called "revolutionary - exaggerated - successful".
We are talking about a new service, which we have called Smash the Cubes.
Smash.. the… what?
Smash means "To destroy, crush" and Cubes is the QQQ, or the ETF that tracks the performance of the Nasdaq100... the Americans call it "triple q" or "Cubes".
Smash the Cubes. Destroy the Nasdaq.
The Smash the Cubes is a basket of strategies that invests in Nasdaq100 shares with the aim of having higher returns and lower losses than a portfolio of a buy and hold investment on the QQQ.
For those who have known us for the longest time, they know that we are not Traders or Technical Analysts who are selling their "only strategy to beat the market".
We believe that the deep knowledge of various strategies and their interchangeability are the right mix to face the markets in an aware way and to obtain winning results.
Smash the Cubes was born from a need for diversification.
Explained football speaking:
Don't rely on just one player to win the match. Each player has his precise role, and with the help of each one it is possible to achieve the desired goal.

Why a new portfolio?
You already know our discretionary equity portfolio of which we report the results week after week, you can read a summary here, which over time has been joined by other types of strategies.
Let's be clear, accumulating ETFs like the Nasdaq100 is perfectly fine, based on one's financial goals.
We live this world up close, using the skills we have to obtain the best possible returns.
Since it is possible to do so, we are sharing it to all of you as well.
What are the differences?
There are many substantial differences with the trading portfolio that you have known for some time by now:
Our benchmark is the NASDAQ100 (ETF ticker: QQQ).
The goal is to have higher returns (Compound Performance, CAGR) and lower drawdowns (losses), obviously compared to the chosen benchmark.
Management: 100% systematic.
Operating profile: 100% long.
Exposure: up to 100% of the capital. Part of the liquidity may be used to limit the volatility of the portfolio, according to analytical criteria decided at the time of the monthly rebalancing. No leverage is used.
Composition: up to 20 stocks included in the Nasdaq100 according to the logic of momentum, correlation and market volatility.
Operation: monthly portfolio rebalancing.
Management time: we spend 20-30 minutes a month to carry out securities trading operations.
Minimum Equity Required: $8,000 is the minimum required considering that only a handful of NASDAQ100 stocks exceed $250.
Other useful info:
News like FED meeting, interest rate update, business cycles, earnings release, etc. they will have no influence on portfolio management.
The minimum time horizon considered is > 3-5 years. In this way, any cyclical bear markets are historically reabsorbed.
Disclaimer
The results we are about to present determine, once again, that a correct choice of stock picking allows us to outperform the reference market.
Obviously one is exposed to greater specific risk (less diversification), but given the decidedly interesting returns that we are about to present… I would say that this risk can be taken for a trading portfolio.
Dutiful clarification: Trading portfolio means (following all the literature) a maximum capital allocation of 15% (exaggerating 20%)... on which we can afford wide swings in favor of higher and hypothetical returns.
The results are historical and obviously do not give any guarantee of any future profits.
The commission costs of the purchase and sale of the shares are already included in the results presented (considering $0.35 per transaction which is what Interactive Brokers applies on average for an average account of $100k).
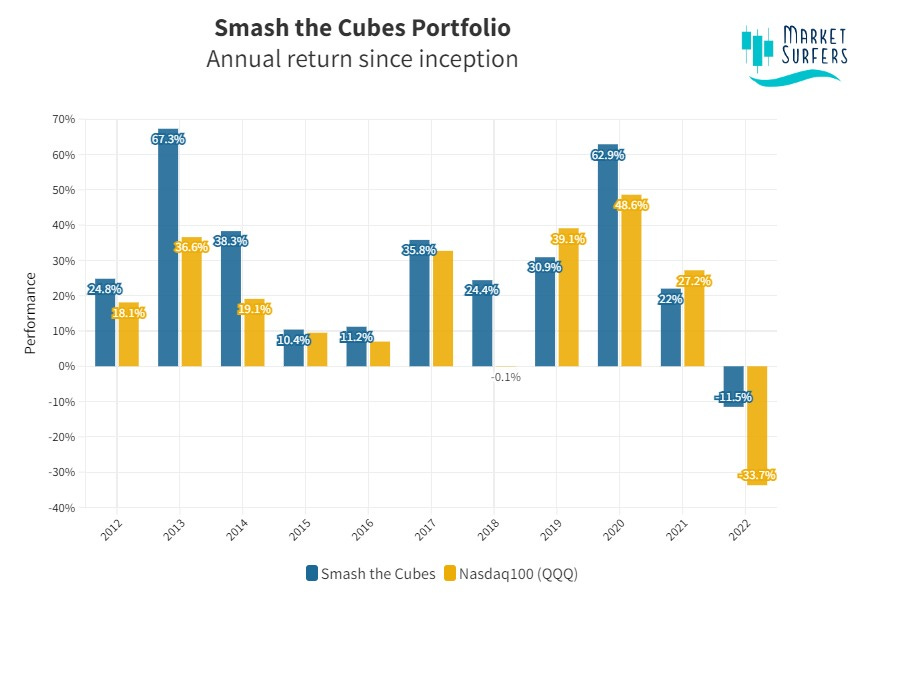
Annual returns from 2012
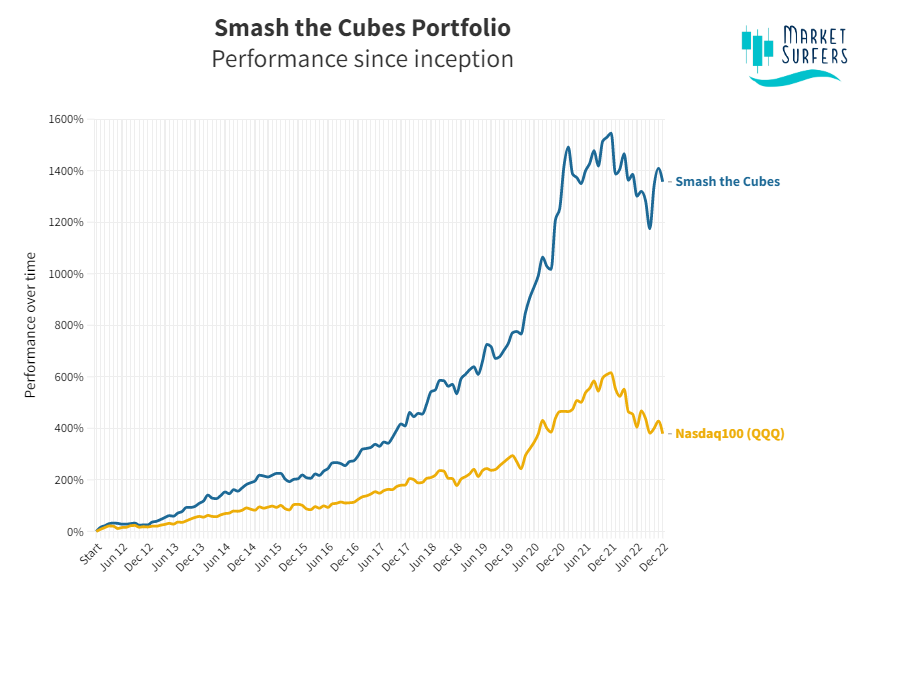
Equity line from 2012
[Gross Profits, calculate your taxes based on your country]
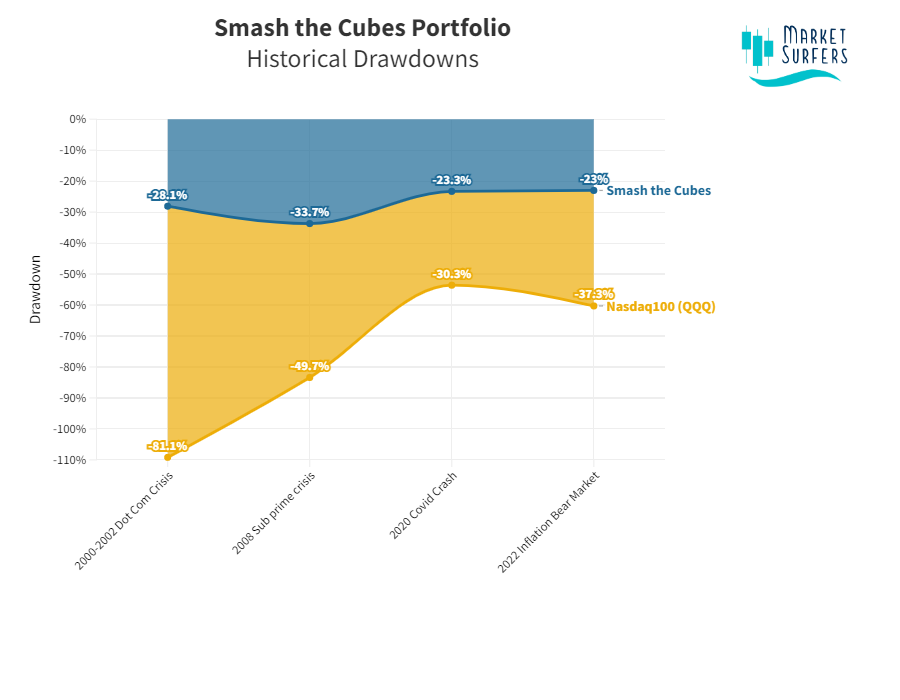
Historical drawdown from 2012
The portfolio is resilient during the worst crashes in recent history.

Historical drawdown from 2012
Il portafoglio è stato resiliente anche durante la bolla Dot-Com, la crisi Lehman Brothers, il Covid crash e il recente bear market inflattivo.
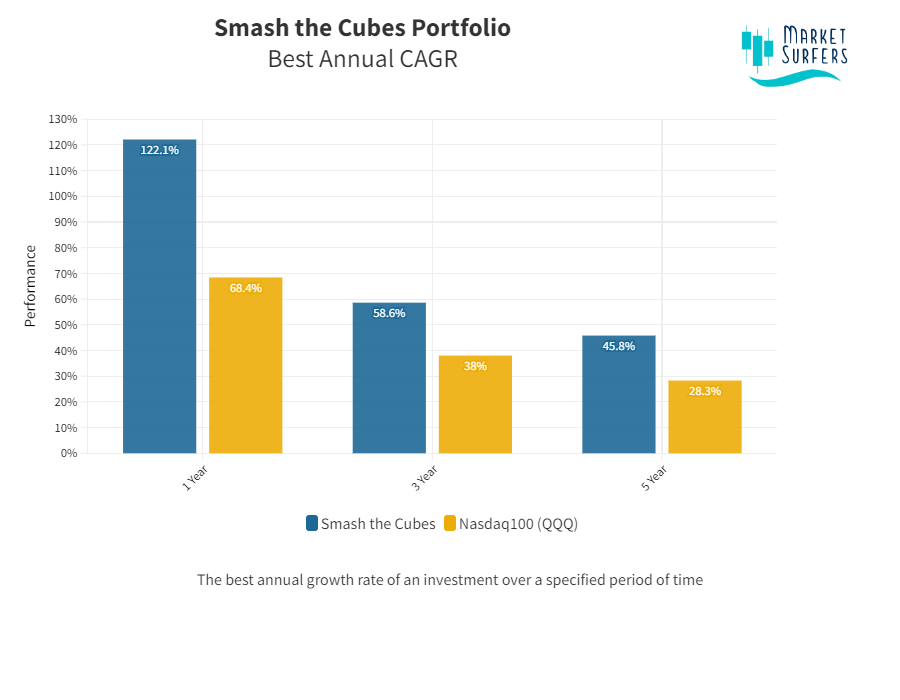
Altre metriche
In questo grafico sono visibili i migliori CAGR, ovvero il rendimento composto che avremmo nello scenario migliore di investimento, anno dopo anno, reinvestendo profitti e dividendi:
In questo altro grafico, invece, il CAGR è rappresentato sotto forma di media annuale:

Bene… adesso che ho letto fino in fondo… come si continua?
La risposta è semplice: nello stesso modo in cui trasmettiamo ciò che conosciamo.
In modo trasparente.
Sincero.
Con passione.
Domani, domenica 8 gennaio, sveleremo le azioni che inseriremo nel nostro personale portafoglio di Trading seguendo lo Smash The Cubes per tutto il mese di gennaio 2023.
Ogni mese, invieremo i risultati del mese precedente e la lista delle azioni per il mese successivo.
Tutto questo, per darvi un nuovo servizio.
Per far crescere la nostra community.
Per surfare il mare dei mercati insieme 🏄♂️
A presto!
I vostri Surfers.