

The most bearish period of the year is over (almost)
The most bearish period of the year is over (almost)
Market Recap, Week 18-22 September 2023 [ENG]

Happy Sunday surfers!
As promised my schedule did not prevent me from writing this article, with not a few difficulties, but the topics discussed will serve to put into context the distressing week we had
In this appointment, we talked about:
S&P 500 testing support
Sentiment analysis
Commentary on the FED
A look at commodities
S&P 500 testing support
Cyclically, the catastrophists come out of hibernation and the news is full of negativity.
Articles that cry about financial catastrophe attract many more clicks than those that talk about bullish scenarios instead.
In the last 50 years, there have been 5 events that we can call systematic collapses: 1974, 1987, 2001-2002, 2008, and 2020. An average of one every 12 years.
But there are perennial bears who try to predict one every year and every time the stock market goes up, they double down, never admitting defeat. One day (roughly once every 12 years), they are right and claim to be heroes.
Feel free to listen to headlines whoever you want, but this will test you psychologically because on average you will have to wait 12 years before you are “right.” Instead, I encourage you to always consider scenarios in PROSPECTIVE.
In mid-July, I talked about warning signs, all of them short-term, and how we might have a difficult summer.
I certainly did not guarantee it, but simply suggested that the short-term risks had increased relative to the possible returns, and now we are again testing what I had identified as support 2 of the S&P 500.

Compared to last week's chart, in this one, I have highlighted the whole support area of interest which is very important from which I expect a reaction in the medium term.
I remain for almost the entire portfolio in cash and if the S&P 500 closes below, I will be 100 percent in cash and wait for the next opportunity, remaining 100 percent convinced that we are in a secular bull market, but we still need to have a demerit line to avoid devastating losses.
RISK ON signals, however, do not support a further decline.
The various index-sector ratios that I cyclically publish are all higher than the August low.
This means that while the S&P 500 has moved below the August low of 4335, capital has NOT moved out of key stocks that support growth in the medium to long term.
If anything, I could argue that large Wall Street firms are using this decline as another opportunity to load up their portfolios before another surge in the fourth quarter.
Time will tell, but I will watch it every day.
Sentiment analysis
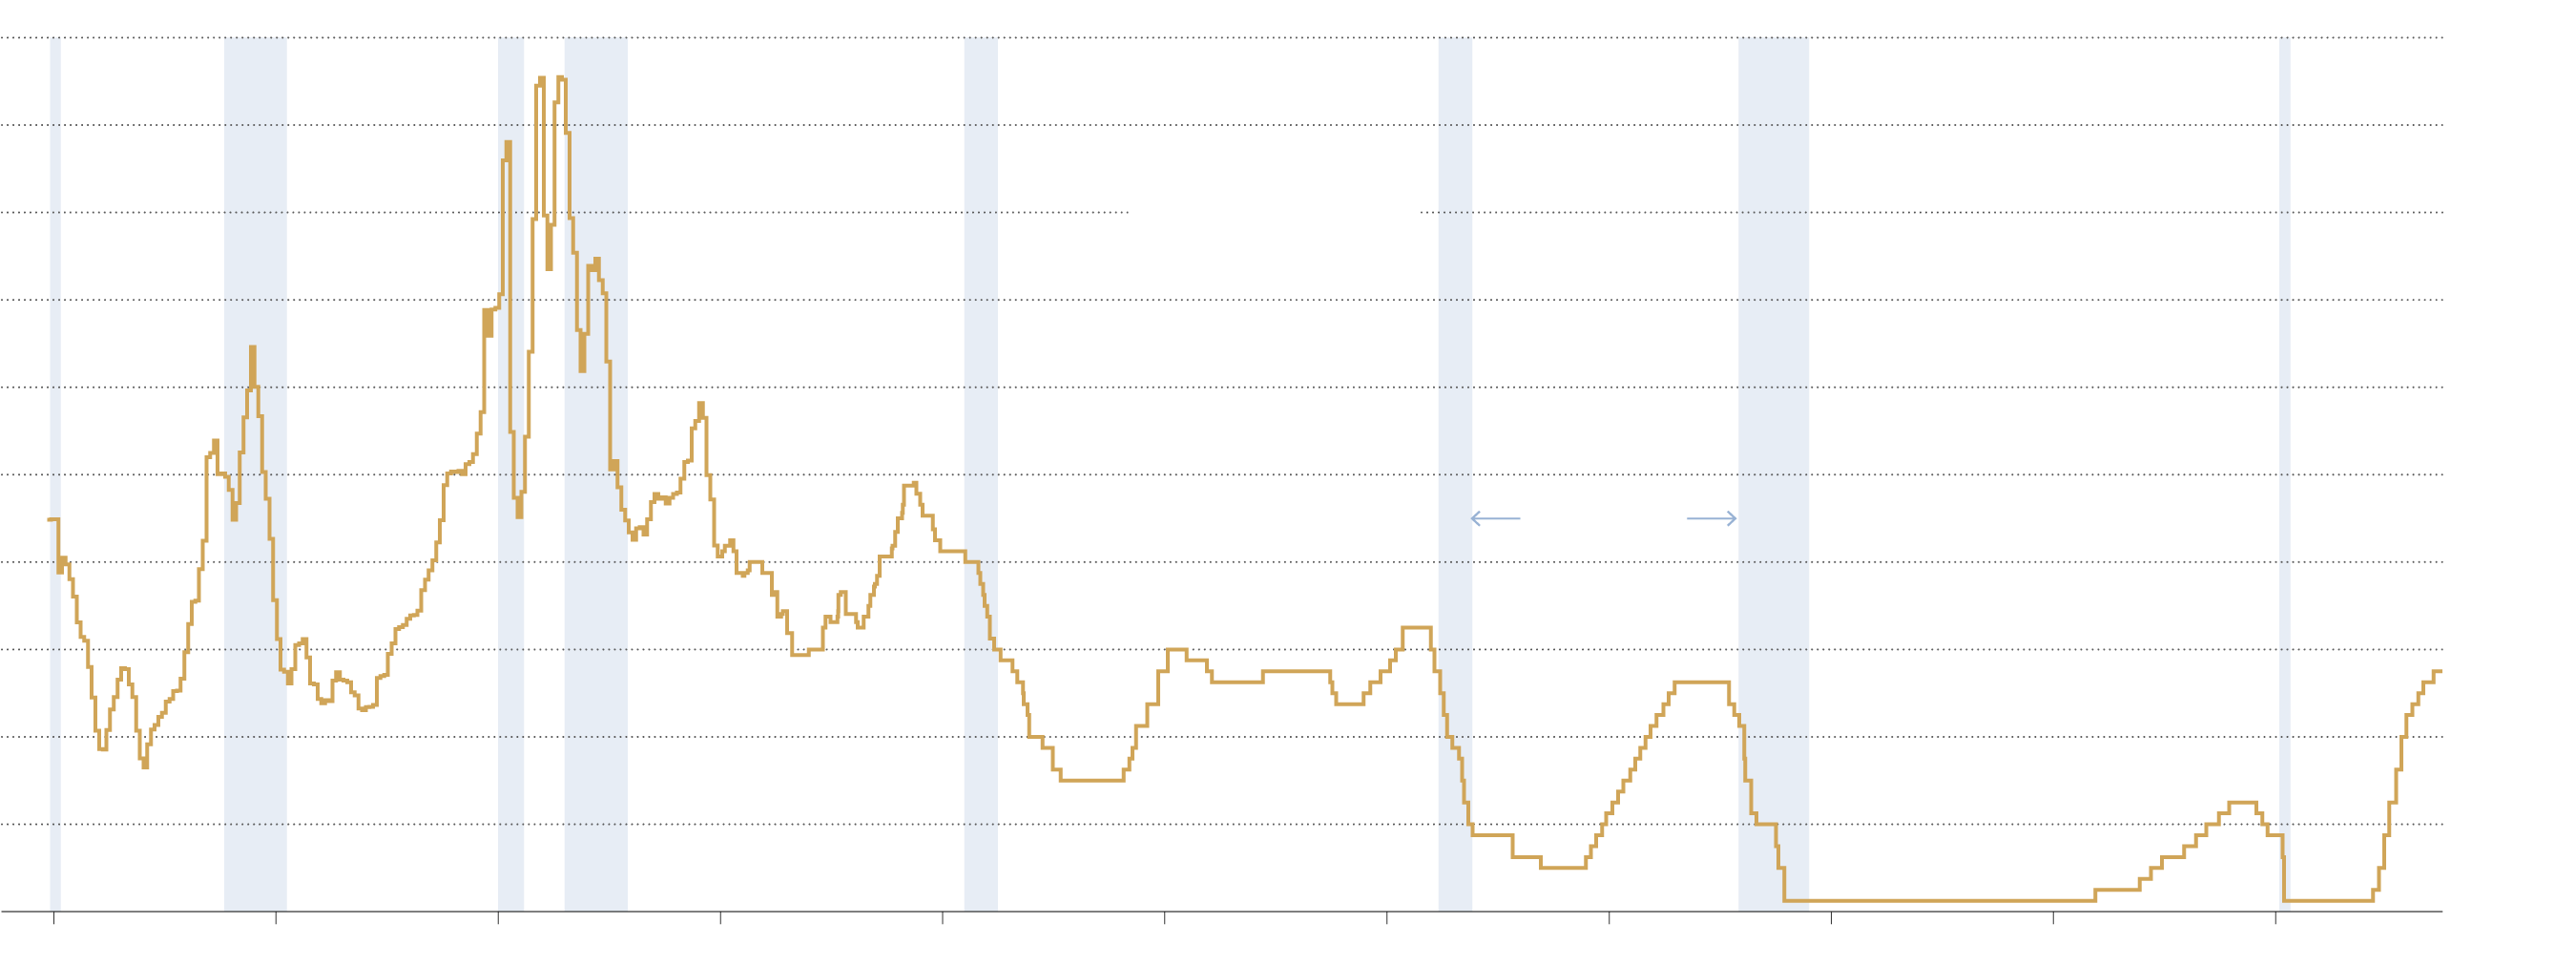
Often in these articles, you have seen the CPCE ratio (PUT CALL ratio), where at the moment the 5-day moving average beats around 0.8 showing extreme fear ( although the recent past has accustomed us to more extreme values)
In my opinion, based on this sentiment indicator, the downturn has minimal potential.
This does not mean that we will not see some fluctuation this week, and perhaps one or two days of rapid downward movement. After all, the week after the FED could still be quite volatile inserted in the context of the worst time of the year.
Take a look at this graph

Usually, when I see CPCE readings like this, I am extremely bullish, and I am extremely bullish, but I am not a clueless person who goes ALL IN based on a signal, I want to see a price reaction.
My ideal scenario would be another drop in the first half of the week, and then consider starting to build new bullish positions.
A comment on the FED
Many of you have probably already heard what Powell said, so I won't repeat everything, but in short, he kept interest rates unchanged but remained open to another increase this year. Also, they do not expect to cut rates next year to the extent previously expected, with the economy going “stronger than we expected.”
When you're at that level, like that of a major central bank president, he certainly might know a thing or two more than the rest of us, but at the same time it also remains extremely difficult for him to predict macroeconomic forces but for the most part they are operating even at the same level as us, which means it's difficult if not impossible to predict macro forces.
So currently there is not much news on this front, we could talk about it for hours, but let us stay focused on what we do best, which is price action and market analysis.
A look at commodities
I don't talk much about commodities, but let's analyze 2 commodities on a weekly timeframe.
Crude Oil
As might be expected, when crude oil prices rise, the XLE (energy ETF) tends to outperform the benchmark S&P 500.
The bottom panel shows that this positive correlation generally occurs. Thus, if you can understand the direction of crude oil prices, you will have a fairly good idea of whether to overweight or underweight the energy sector.

Currently, the price of oil seems to be in a strong bullish phase, so picking stocks inside XLE might make sense although, I must admit that over the years I have been frustrated with this group because it is a group that may be in line with bullish markets or not, in short, it is not my favorite group, so I tend to underweight it.
Copper
Copper is consolidating very constructively, should the symmetrical triangle hold.
In symmetric triangle is a continuation pattern that typically continues the direction of the previous trend, so in this case, I am looking for directional movement of copper to the upside.

Recently we have seen a negative, or inverse, correlation between copper prices and the S&P 500 index, which is unusual. Normally, copper follows the prices of the S&P 500.
My view is that copper has been weak in 2023 because global demand (China, for example) is not as strong as the U.S. demand. Most signals indicate that the U.S. economy is stronger than most foreign economies. Therefore, an upward break in copper would be a signal of improving global economic strength.
Happy trading!