

And then comes the weakness
And then comes the weakness
Market Recap, Week 31 July – 4 August 2023 [ENG]

This week's downgrade of U.S. debt coincided with recent weakness in equities, but the charts signaled that the stock market was hanging on by a thread after the soaring momentum in the first two quarters of the year.
In this appointment, we will see:
The downgrade of the United States! Now what?
Here the pullback
Operations Surfers portfolio
You don't live only on Large Cap
The downgrade of the United States! Now what?
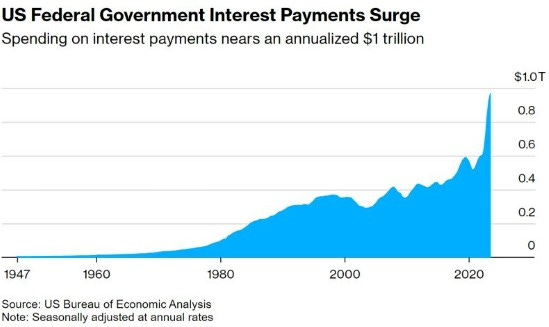
The S&P 500 index closed on the lows of the week with an overall decline of -2.28 percent, marking the worst week in nearly five months.
Many attribute the recent weakness to the downgrade of U.S. debt, but I disagree... Let's get some clarity.
The recent downgrade of the United States by Fitch is not expected to have a significant impact on investors and market participants. Although the downgrade from AAA to AA+ is noteworthy, it is essential to understand the context and needs of various institutional players.
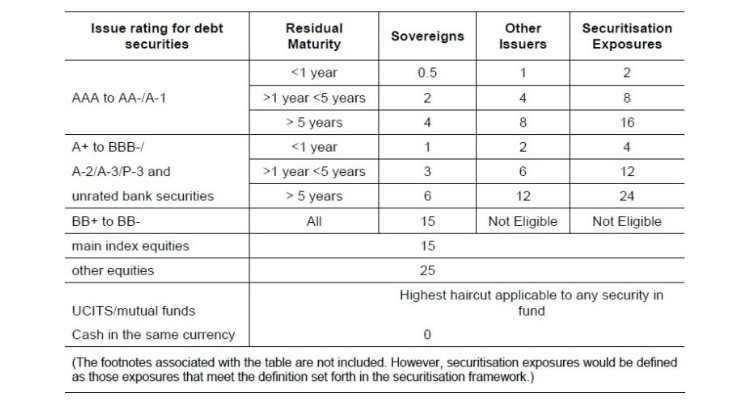
Commercial banks, one of the largest buyers of U.S. Treasuries, will not be affected by the downgrade.
Most banks use an approach whereby AA+ rating should make no difference:
Pension funds and insurance companies, also significant buyers of Treasuries, use them as long-term assets to meet their long-term liabilities. The downgrade to AA+ should not have a significant impact on these institutions, as it falls within the same risk range.
If there were concerns about the quality of U.S. Treasury collateral, this would reflect on swap spreads, and at the moment there is no significant reaction, indicating that the market is not overly concerned.
This last passage is very technical; in short, there are no catastrophic conditions from the 2008 crisis.
Here the pullback
Although many attribute the recent weakness to the downgrade of U.S. debt, we had already pointed out on these screens the various technical reasons why the highs could have been near ⇾ Dark clouds on the horizon,July 14.
It was a wild week for the market closing where the Nasdaq was the worst.
But let's go step by step…
Today we will look at the situation on the daily chart while in the next appointment, we will return to find insights on the intraday rotation, which, at the moment, is still bearish.
S&P500
It took 8 months for everyone to understand that we are back in the bull market.
The amplitude improving, the recession not coming, and we see the beginning of what could be the most classic of pullbacks, when the S&P 500 index, after a phenomenal run and running out of breath, crashed to 4600 points, the short-term resistance highlighted on the weekly chart. For the weekly chart click here, today we resume the daily chart, the timeframe I was most concerned about in recent weeks.

It is crystal clear how all RISK ON ratios have risen for the entire 10-month uptrend since the October 2022 lows, this is a bull market, no doubt about it.
Some ratios go up earlier, some later, and some have an advantage over others. In other words, not all ratios go up to the same extent or at the same time, but it is quite clear that they all go up during a bullish trend.
The recent pullback was nothing if we see the big picture of RISK ON and RISK OFF ratios, but we will come back to this in the next appointment
In the figure I have highlighted what I think are the key levels to monitor, and I think the most important of all is between 4300 and 4350 points, the area that coincides with the August highs.
Most likely we will get down there, and there we will start looking for evidence of support, considering also that, statistically, the next 6 weeks do not smile on the stock market as a whole.
Nasdaq100
The Nasdaq100 has come to test the breakout zone of the cup and handle pattern on the h1 chart from earlier this month, A bullish pattern for the Nasdaq 100.
Target reached and then down again, and has every intention of continuing down.
Here, too, I have brought back a chart with the supports highlighted in the past weeks, and here, too, it will be a “game” of patient waiting.

I'll be honest, I don't like the fact that prices have broken through the 20-period moving average downward with that nasty negative divergence that has given me severe headaches since early July.
A full short-to-medium-term reset is needed, even considering that capital is rotating out of tech and into defensive sectors in the short term... We will shed light on this in future articles.

So this is perfectly normal, just as all the strength of the last few quarters has been, and the selling pressure at this time of year is in line with historical norms.
Semiconductor industry
Since this is one of the most influential industry groups, it will be difficult for the market to continue to rise unless driven by this very important market area.

The inability of the AD line to move upward with price action suggests that we may see further selling in the semiconductor sector, where the most important support is in the 8250 point area, while further up we have 9250-9000
Short period
The daily chart of the S&P500 shows that we may have another 3-4% decline before a short-term low; I doubt we will see a deeper plunge, at least for now with the data we have available.
I think the best course of action is to buy this weakness at the right time when conditions are favorable
Operations Surfers Portfolio
As written in the dedicated telegram group, we currently remain to wait patiently without opening new positions.
The market has started its pullback, a short-term retracement in an intermediate bullish trend, so we should do nothing but wait, and still wait for the exact time to reload.
So no fear, we have our stops placed, and we will see how many of the stocks we have bought in the past months will be real winners in the next upward leg.
“Pullbacks allow you to determine whether the stock in your portfolio is a tennis ball or an egg.”
Enjoy these weeks as you see fit, having fun with friends or spending quality time with your families.
But always keep notifications on, because the situation could quickly change.
You don't live only on Large Cap
Nasdaq 100 and S&P 500 we know well that these are the indices that track the most capitalized companies in the U.S. market. With the closing of the third quarterly earnings cycle of this 2023 likely profit-taking will continue, and capital outflows from the large and mega caps will pour into the small and mid-caps… In fact, this is already happening in plain sight!
In fact, small caps close their third month in a row of outperformance against the benchmark S&P500 (we use ETF SPY here).

It is clear to me that capital is going to more value market areas and to small and mid-caps, I have said this several times, but I will tell you that if I had to choose a capitalization between small and mid-caps, I would choose mid-caps.
Here's why:
Technically they are better set up
breadth is better in mid-caps than in small
mid is more “docile” than small
We look at the daily chart of #IWM and see that the 20-day moving average is currently doing a great job and may continue to perform its support function.

For this sector, the same technical considerations were made in the article Small caps on the brink of the breakout?
I expect the lows of the week just ended to hold, but if that does not happen, the area around $190 would be a good place to buy on weakness.
Happy trading!