

Market Recap, Week 17 Oct-21 Oct 2022 [ENG]
Market Recap, Week 17 Oct-21 Oct 2022 [ENG]

Today's column will be different from the usual, less technical but full of interesting insights into the macro scenario and the implications that it may bring to us traders and investors.
An invitation to think about markets differently from the crowd.
The topic is very broad, which is why we decided to divide it into two parts.
Are you ready?
Let's go!
Doomsday
We always try to be optimistic most of the time, but it has been a really frustrating year; it is also the time when risk mitigation and downside protection are most important. This is where true alpha is created in the long run, this is where most of the "gurus" or alleged inexperienced trainers fall.
2022 snapshot
Let's make a summary of this 2022:
Stock market at -30%
Long-Term Treasuries, which should be RISK-OFF's business, fell more than 40%!
Gold is down 8%, despite many investors viewing it as a hedge against inflation.
The only sector that has done well this year is energy, but we doubt that investors see this sector as a safe haven comparable to gold.

For this reason, in our investments we have preferred to use a dynamic approach between the various asset classes rather than a static, albeit efficient, allocation.
If you're wondering, yes, cash is an asset class and it's not bad to get cash if you know what you're doing and if you have robust models!
Here are our last three years of our two most balanced investment portfolios (in blue Market Surfers, in yellow a classic 60/40, compound yield indicated in%):
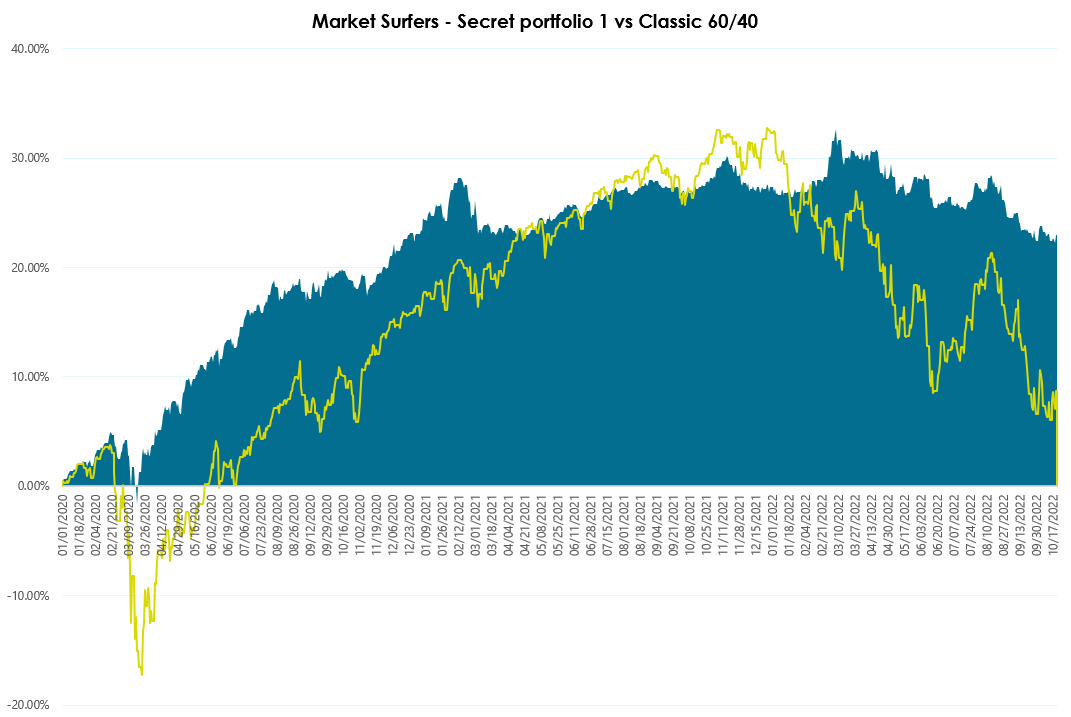
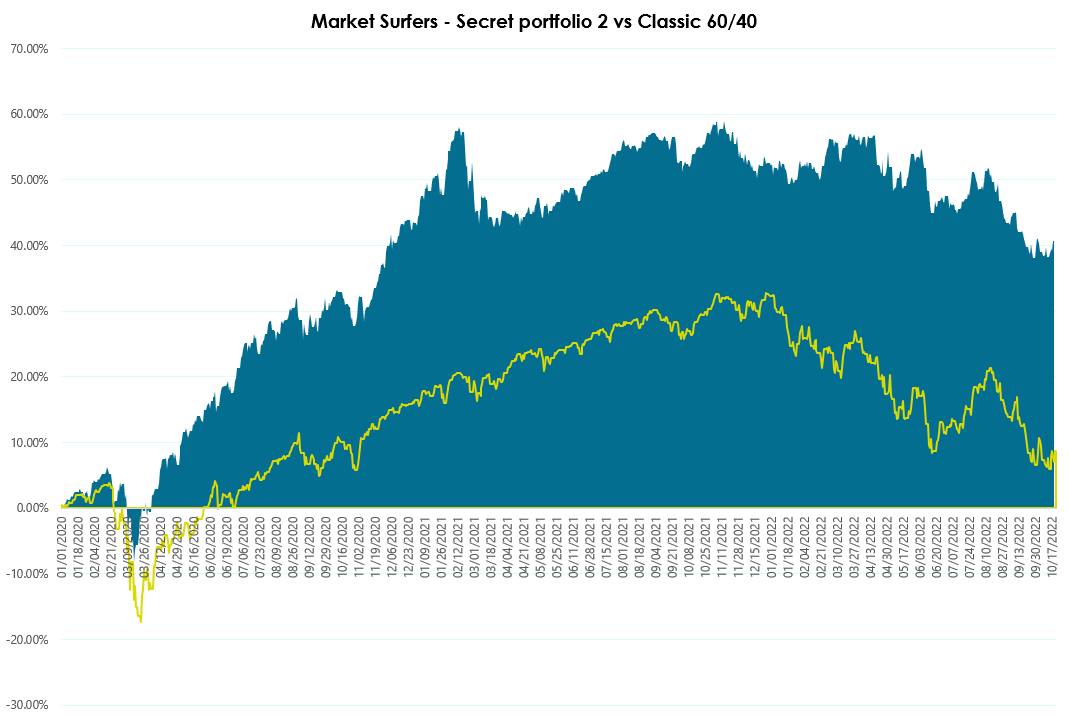
Keep following us if you are curious about our investment portfolios!👀
But now a very important question…
…is the System falling apart?
Less informed investors and traders make their decisions after reading data such as:
GDP
unemployment,
inflation,
Useful
etc.
All very important data, but many times we notice that these data are "analyzed" incorrectly
Instead of looking at these data individually or at a couple (the most famous is Inflation & the Labor Market) it would be advisable to take off the blinders and take a look at the entire American economic and financial system.
The whole system, we say it in a low voice, seems close to breaking.
It may not happen today, next year and it may not happen in five years, but if things do not change, there is a great risk of overloading the system so much that eventually the accumulated debt will become completely unmanageable and the whole castle of cards will collapse by burning.

The Debts situation
We usually look at the $31 trillion in government debt as the basis for our reasoning. If you remember we had introduced the topic here Daily Report, September 13th 2022
The government is already paying about $700 billion annually in interest charges on existing debt, when the weighted average interest rate on all Treasuries was about 1.5%.

Today, Treasury yields with a maturity of 1-5 years are hovering around 4.5%.
Can you imagine what will happen if the cost of US Treasury debt double or even triple with a sustained rise in interest rates?
We have already heard something crunching around the world such as in the UK where they almost had a collapse of the entire pension system which forced the Bank of England to step in to keep the system afloat.
... End of the first part ...
In the mid-week appointment, we will continue to deal with the macro topic
Passiamo al lato tecnico
The good news is that the stock market remains quite strong, despite the very rapid rise in the 10-year government bond yield ($ TNX).
Below is the short-term graph that we propose in each column, like the last two (HERE e HERE).

Currently, the condition we expected has occurred as reported in the Stock under the lens 29/09/2022 to reverse the bearish momentum: breaking and subsequent holding of the bearish channel. We also see a nice bullish Head and Shoulders pattern in formation if we manage to overcome 3800 points decisively, hoping that it does not turn into yet another false break.
For the most part, 10-year treasury bond yields (#TNX) have proven to be a barrier to the stock market this 2022.
What we would like to see is a decrease in yields in order to have greater confidence in a bullish movement (we talked about it HERE)
Fear is the bear's best friend, #VIX
We saw fresh lows of the S&P500 which were accompanied by lower highs of the VIX.
In other words, market participants are becoming less fearful of new lows, and this is historically bullish.
Here's what the S & P500 and VIX currently look like:
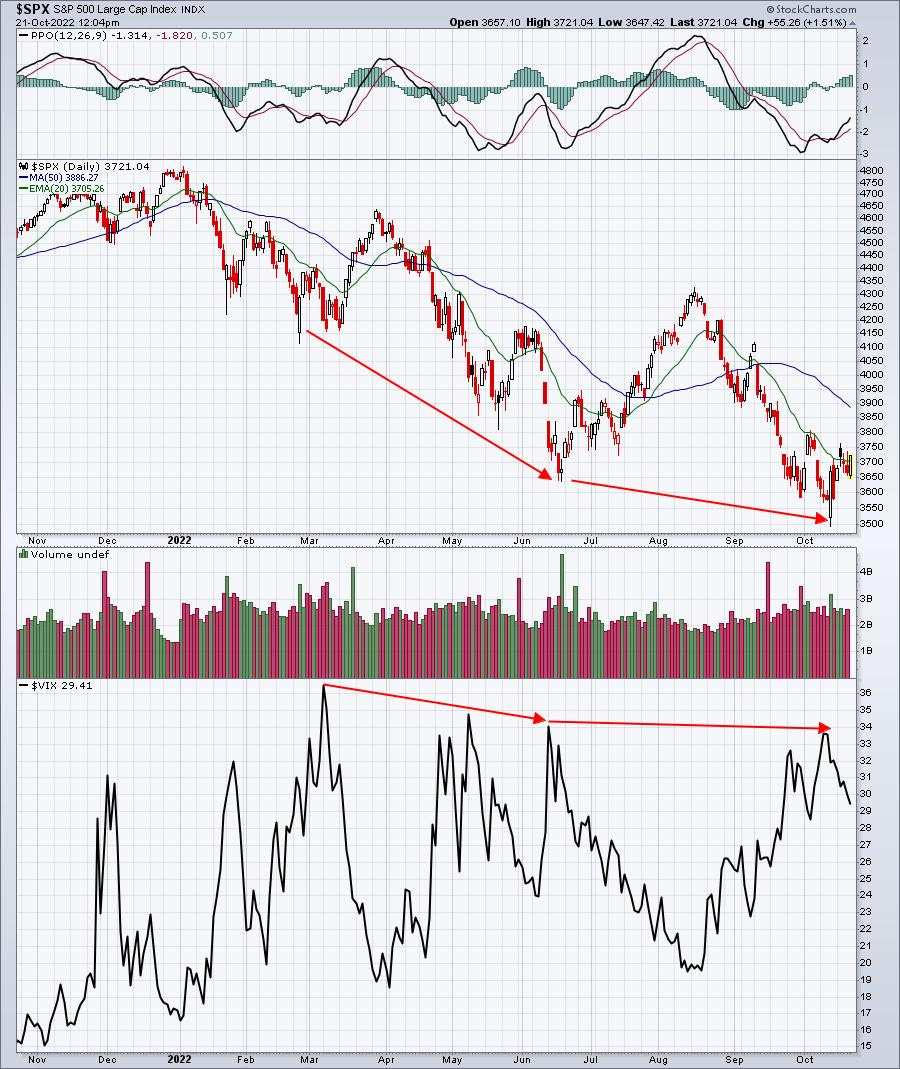
We will not say that fear is disappearing completely, but we have addressed this discussion HERE, HERE and in many other columns where we talk about the PUT CALL ratio.
But if we were bearish, which is not true, we would really like to see new highs on the VIX and the market is not cooperating right now.