

We touched the low
We touched the low
Market Recap, Week 7 – 11 August 2023 [ENG]

Happy Saturday Surfers,
before we start some service announcements
The first is that we take a breather for 10 days, this you read will be the last article of the week, and we will see you again with the date scheduled around August 23.
Should there be any extraordinary events in the markets, we will still keep you updated! 🙌
I would like to make it clear that the operation of the Surfers Portfolio will be guaranteed.
Second (very good!) news: In September, we will have the long-awaited website online! I would like to point out that it is completely self-produced; we are sure you will appreciate the effort so far.
It will be one more step toward the mission of Market Surfers and, if you haven't yet done so in the past, every time you read an article, push this button below to share this reality with fellow traders and investors who don't know us yet.
Let us know how much you appreciate our content, which has been available for over 18 months for free!
Moving on to graphs, today we will discuss:
Someone gives small caps a nudge
Rotation out of technology
The VIX tells us that the low is near
An intraday look at RISK ON reports
Bull markets are not linear
Operations Surfers Portfolio
Someone gives small caps a nudge
Weak week for small caps, coming to test support in the $190/188 area identified.
Although the segment manages to outperform the Nasdaq 100, the same cannot be said if we compare it with the S&P 500, from which it loses ground.

The Accumulation Distribution line continues to make new highs as the PPO unloads, preparing for a new upward extension.
Now the area in question absolutely must hold to sink a new and decisive blow to the area highlighted in red.
However, the situation remains constructive in the short term as long as support lands and as long as we remain in the bullish channel highlighted by the dashed black lines.
Let's take a look in the long run, replaying this chart shared in March 2023, and see that we are still in the accumulation phase on the lows:

This phase will remain one of accumulation as long as the lows at $160 remain intact.
Yes I know, the distance from $190 is really a lot, however, I see that the PPO on the weekly has a bullish setting, and, barring yet another return below $180, the situation remains constructively bullish.
Not to mention that it underperforms the SPY in the long run, but mind you that it only takes 2 quarters of small-cap out performance to get the portfolio equity off the ground (November 2020 – April 2021 is an example).
Be patient, and be vigilant.
Rotation out of technology
In March 2023 I was writing about how the tech rebound was not over (Technology (XLK): evidence that the rebound is not over), since then only the technology has performed greater than 30%.
But nothing is eternal, and since the technical deadline of July 2023, it has been one of the worst sectors.
After upgrading to all-time highs, it returned below, qualifying this move as a failure breakout.
As seen in the first panel of the chart, capital is rotating out of the sector, and XLK could correct another 3 percent in the less bearish case, or even 8-10 percent from here before reaching support at the August 2022 highs around $151.
This could be a problem for the major indexes in the short term, as the technology sector accounts for 27 percent of the S&P 500 and nearly 50 percent of the Nasdaq.

All important levels for S&P 500, the XLK/S&P 500 ratio, and XLK itself are represented in the figure.
The VIX tells us that the low is near
Remember in early July when the VIX was giving bearish hints? Beware the VIX.
I waited a month before this in-depth study to wait for more signals to develop in the short term (short-term correlation in the chart) to analyze them together.
Remember that the VIX and S&P 500 are inversely correlated, which means:
If VIX rises, S&P 500 falls
If VIX falls, S&P500 rises
Any movement other than the first two is a divergence with bullish or bearish implications.
In the chart we have the short-term correlation, the medium-term correlation, and at the bottom the VIX (in pink) and S&P 500 candlestick.

In the chart above I have indicated what the bearish and bullish signals were in the short term (each highlighted period is 5 days), each of these windows had a positive correlation between these two instruments:
S&P 500 rises and VIX rises, Bearish: -2.35% in following days
S&P 500 drops VIX drops, Bullish: +3% over the next few days
S&P 500 rises and VIX rises, Bearish: -1.4% over the next few days
S&P 500 rises and VIX rises, Bearish: -2.75% over the next few days
S&P 500 drops VIX drops, Bullish: we'll see next week
Mind you, these are not buy-and-sell signals and could end in nothing. This analysis only indicates that market makers are pricing in lower volatility in options in the immediate future and that they expect prices to rise despite S&P500 falls, in other words, a context in which short-term lows are near.
An intraday look at RISK ON reports
Below is the 60-minute candlestick chart of
VIX
S&P500
NASDAQ and S&P500 Ratio (QQQ vs. SPY)
Discretionary and Staples (XLY vs. XLP)
Growth and Value (IWF vs IWD)
Notice how the VIX is falling when the S&P500 is also falling, which is a bullish divergence as we have seen before with bullish implications.

All reports in the previous 30 days show a downward trend, meaning there is a defensive attitude of traders, as anticipated in the July 16 article Dark clouds on the horizon. The following week, the options’ expiration triggered this rotation out of the aggressive areas of the market, confirming weakness in the markets (Risk ON Reports Crunch).
Positive note that XLY vs. XLP is the only one that has shown signs of revival, holding period lows.
It may be that the short-term low is in sight but, without support from the aggressive areas of the market, it is likely to be a rebound to catch its breath but nothing more.
In the box below, on the other hand, we see how Growth has underperformed Value in the past month, warnings had been cast here and here and in other columns such as:
Industrial takes flight on June 29
Don't snub the energy of July 25
In the surfers’ portfolio, we have an exposure in energy with the #RIG stock, entry June 30+26%, while for industrial we have #EH with entry June 12 with a performance of +76% and the first target taken home.
Bull markets are not linear
Although there is overwhelming technical evidence to support a sustained bull market, some pullbacks along the way should be expected.
The table below compares annual price performance and maximum draw downs for the S&P 500, showing that even years with double-digit gains often experience double-digit draw downs.
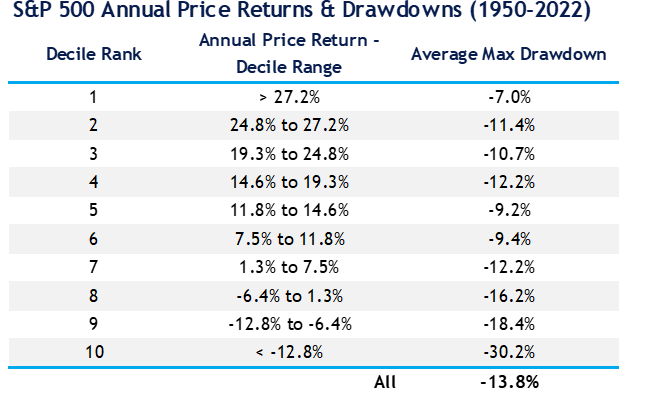
The average maximum drawdown for all years since 1950 is -13.8%. In addition, even years with well above-average price gains are not immune to large draw downs, as on average we have a drawdown of about 10%.
Operations Surfers Portfolio
At this stage of the market, we are suffering from the underperformance of Growth, as we are mainly exposed to sectors such as technology, particularly the software industry (RIOT, MARA and COIN are considered software even though they are related to cryptocurrencies).
This part is to give you an idea of the stock selection decision process and why some strategic portfolio choices are made based on what you read written in these articles.
As mentioned weeks ago in July, the decision was to enter August lightening positions by reducing operations, this was because, as you see from the articles from mid-July onward, the situation was not the best for an upward continuation in the short term.
Why didn't we close everything down?
I preferred to lighten and manage them in portfolio for 4 +1 reasons:
I have a medium-term oriented approach, especially if I have evidence that in the medium term, we are in a bull market and the long term is also aligned.
From a technical point of view, the price of the indices and stocks still in the portfolio did not invalidate the medium-term trends. The weakest ones have been eliminated.
On many stocks, we have a really low carrying price, which gives us a very good risk/reward ratio.
When you think the market doesn't have anymore, that's when it pushes some upward
My goal, as I have been preaching for the past month in articles, was to increase exposure in value.
We have exposure in both the industrial and energy sectors of about 10 percent of the total portfolio exposure.
Unfortunately, not all donuts come with a hole, and the stocks I was watching closely did not have interesting entry patterns, especially with good risk-return ratios.
Therefore, although the 10-day stop from columns, we will do some trading on sectors such as industrial and energy if I see something appealing.
Happy trading!